Go
The Go programming language.
Learn
Official:
- Tour: https://go.dev/tour
- FAQ: https://go.dev/doc/faq
- Best practices 1: https://go.dev/doc/effective_go
- Best practices 2: https://go.dev/wiki/CodeReviewComments
- Documentation: https://go.dev/doc/comment
- Diagnostics (profiling, tracing, debugging): https://go.dev/doc/diagnostics
3rd party:
- Examples: https://gobyexample.com
- Examples (Web): https://gowebexamples.com
- Common mistakes: https://100go.co
- SQL: http://go-database-sql.org
- Testing: https://quii.gitbook.io/learn-go-with-tests
- Optimization: https://goperf.dev
- #todo Ultimate Go Programming by Bill Kennedy
Concurrency
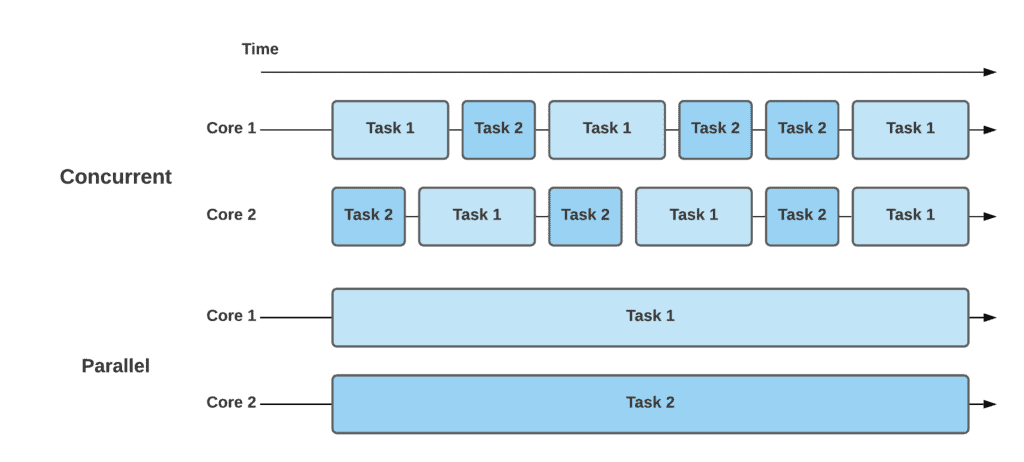
Two threads run concurrently when they are executed on the same CPUs by taking turns. Concurrency is not parallelism. Unlike parallelism, concurrency is useful even with a single CPU because it allows to avoid I/O bound.
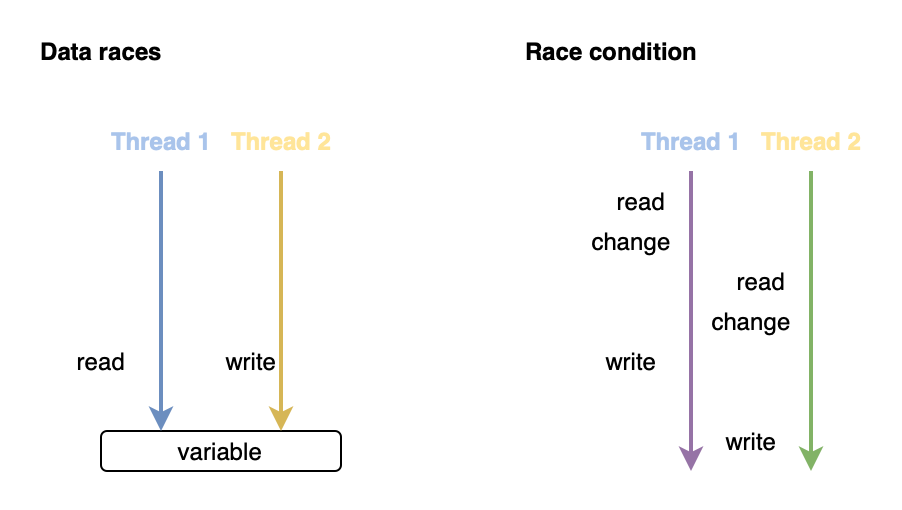
A data race occurs when concurrent threads access the same resource without proper synchronization. Only read-write and write-write accesses cause data races, read-read is fine.
A race condition occurs when the order of changes made by concurrent threads affects the correctness of a program.
A deadlock occurs when concurrent threads block each other and wait indefinitely. The Go runtime detects deadlocks and panics. A livelock is similar, except that concurrent threads actually try to progress, but none succeed.
Resource starvation occurs when a thread does not get enough CPU time to execute.
Goroutines and channels
A goroutine is a lightweight thread managed by the Go runtime. The main advantage over OS threads is faster context switching, which makes goroutines perfect for IO-bound tasks.
A channel is a synchronization primitive used for communication between goroutines.
Channel caveats:
- A send to a closed channel panics
- A receive from a closed channel returns the default value
- A send/receive to/from a nil channel blocks forever
Common mistakes:
Internals
A string is a struct of len int and a pointer to the underlying bytes.
See reflect.StringHeader.
A slice is a struct of len int, cap int, and a pointer to the underlying array.
It's not possible to change the size of a slice passed to a function (because len int is copied),
but it's possible to modify individual elements.
See reflect.SliceHeader.
A map is a pointer to an array of buckets, each containing 8 key-value pairs. Only comparable types can be used as keys. When a bucket is full, a new bucket is chained from it. When the load factor is high, a new array of x2 size is allocated, then data is evacuated incrementally. A map can only grow, it never shrinks. It's not possible to take the address of a map value, because evacuation can happen at any time.
An interface is a struct of a pointer to the actual value and a pointer to the type information (called itable).
The latter contains a list of function pointers to the methods of the concrete type.
When an interface method is called,
the runtime calls the function pointer of the same name and passes the actual value as the first parameter.
An interface is nil only if both the value and the type are nil.
See also Go Data Structures: Interfaces by Russ Cox.
A channel is a struct of a mutex, a ring buffer for values, and send/receive queues of goroutines for when the buffer is full/empty. If a goroutine is blocked on receive, the next value sent to the channel is copied directly to its stack, ignoring the buffer.
A mutex is a struct of two atomic values.
An atomic is a value with the hardware support for atomic operations.
Scheduling
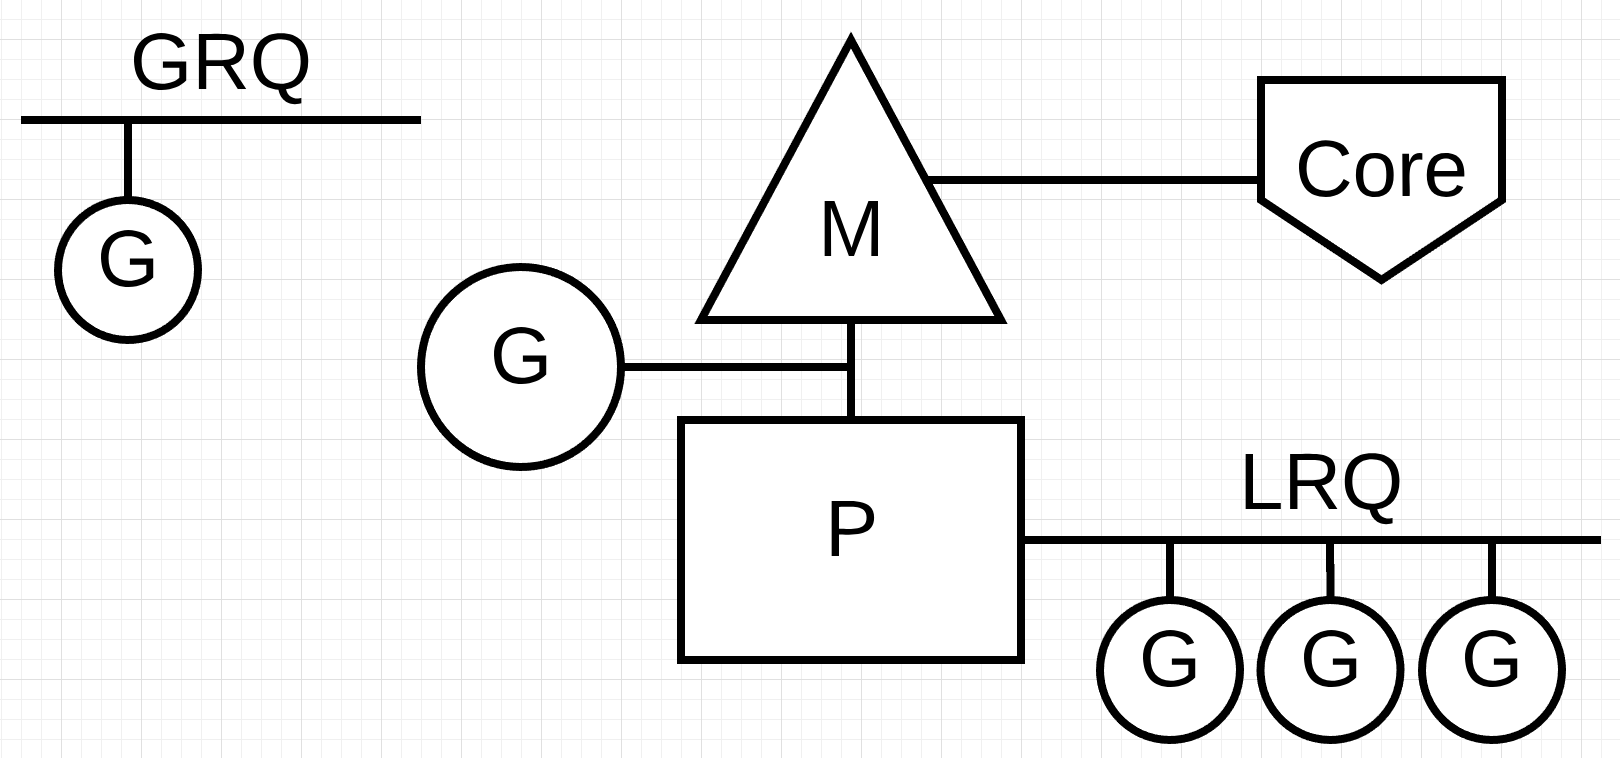
Entities:
- G (goroutine) is a task to run
- P (processor) is a task runner with a queue of Gs to run (LRQ)
- M (machine) is a virtual machine (OS thread) on which a P runs Gs
Usually, the number of Ps is equal to the number of Ms, which is equal to the number of CPU cores. The number of Gs has no limit.
❓ Help
Why are P and M separate entities if they are usually 1:1? Because a P can run on different Ms. For example, when a G makes a syscall, the OS suspends the thread (the M) it is running on. This means that all other Gs queued on the same P are also blocked. To avoid this situation, the scheduler moves this P to another free M (or creates a new one if none is free).
The scheduler implements the concept of work stealing: if a P has no Gs to run, it can try to steal half of Gs from another P.
There is also a global queue of Gs (GRQ) that have not yet been assigned to a P. If there is nothing to run or steal, a P will take some Gs from it.
💡 Hint
Useruntime.GOMAXPROCS()to limit the total number of Ps.Use
runtime.LockOSThread()to bind the calling G to the M it is running on.
Scheduler types:
- Preemptive: the scheduler decides when to suspend threads
- Cooperative: threads voluntarily return control to the scheduler
Prior to Go 1.14, the scheduler was fully cooperative, now it has some preemptive features (to address the problem of tight loops).
💡 Hint
Useruntime.Gosched()to manually switch to another goroutine. Similar calls are inserted by the compiler to implement cooperative scheduling.
The network poller is used to process network I/O more efficiently. It lives on a separate OS thread and its implementation is OS-specific. When a G makes a network syscall, the scheduler moves it to the network poller, where the syscall is made asynchronously. This prevents the OS from suspending the thread this G is running on, and allows the P to run other queued Gs in the meantime. When the syscall is completed, the calling G is returned back to the P's queue.
See also:
- Source code
- Scheduling in Go by Ardan Labs: Part 1, Part 2, Part 3.
- [Blog] The Go scheduler + [Blog] The Go netpoller
- Go Mistakes: Thinking concurrency is always faster
Garbage collection
A garbage collector (GC) is responsible for freeing unused heap memory allocations. It first marks objects that are reachable (i.e., in use) by traversing the allocation graph (BFS) starting from the root objects (stack pointers and global variables), and then deallocates those that are not marked.
Stop-the-world (STW) is a GC state when the entire program is stopped.
In Go, the GC implements the concurrent Tri-color mark-and-sweep algorithm.
Colors:
- White: unreachable, candidates for deallocation
- Grey: reachable, may have references to white nodes
- Black: reachable, no references to white nodes
Algorithm:
- Pick a grey node
- Paint all white nodes it references with grey
- Paint this node with black
- Repeat until there are no more grey nodes
During a GC run, STW happens twice for a short period of time. The rest of the time, free Ps can still do useful work concurrently, including allocating new memory. This means that the GC needs to track all reference changes in order to work correctly. It does this by using write barriers, which are enabled during the marking phase. See [Blog] Write barriers in the Go GC for more details.
Phases:
- Marking: prepare (STW, enable WBs) -> mark -> terminate (STW, disable WBs, do cleanups)
- Sweeping: reclaim GCed memory (periodically in the background and on new allocations)
✏️ Note
The GC uses ~25% of the CPU capacity for its needs and runs in its own goroutines. By default, the next GC run is triggered when the heap size doubles.
✏️ Note
Mark Assist If a G makes a lot of new allocations during the marking phase, the GC may not be able to finish in time. In this case, the GC can "punish" that G by temporarily turning it into an assistant. The more allocations a G makes, the more time it spends in Mark Assist mode.
- #todo Tracing using
GODEBUG=gctrace=1. - #todo Escape analysis using
-gcflags=-m. - #todo Configuration using
GOGCandGOMEMLIMIT.
See also:
- Source code
- Official guide
- Garbage Collection in Go by Ardan Labs: Part 1, Part 2, Part 3.
Profiling
Profiling is a type of dynamic program analysis commonly used for optimization.
Profiles are collected as files and visualized using the pprof tool.
Learn:
- https://go.dev/doc/diagnostics
- https://github.com/google/pprof/blob/main/doc/README.md
- https://github.com/DataDog/go-profiler-notes
- https://100go.co/98-profiling-execution-tracing
- https://rakyll.org/profiler-labels
Packages:
- runtime/pprof for CLI tools
- net/http/pprof for HTTP servers
Profiles:
cpu: CPU time usageallocs: total memory allocationsheap: in-use memory allocations
Columns:
flat: the resources used by the function itselfcum: the resources used by the function itself and the functions it calls
Commands:
top [n]: print top n calls (sorted byflatby default, pass-cumto sort by cumulative sum)peek <regexp>: print calls matching regexplist <regexp>: print calls matching regexp with surrounding codeweb: visualize call graph in web browser
PGO: Profile-guided optimization. Normally, a compiler only uses the source code to make optimization decisions. With profiling metrics collected from production, it can perform more aggressive optimizations.
Code style
- Uber: https://github.com/uber-go/guide/blob/master/style.md
- Google: https://google.github.io/styleguide/go/decisions